Xero Dashboards for Clear Financial Visibility
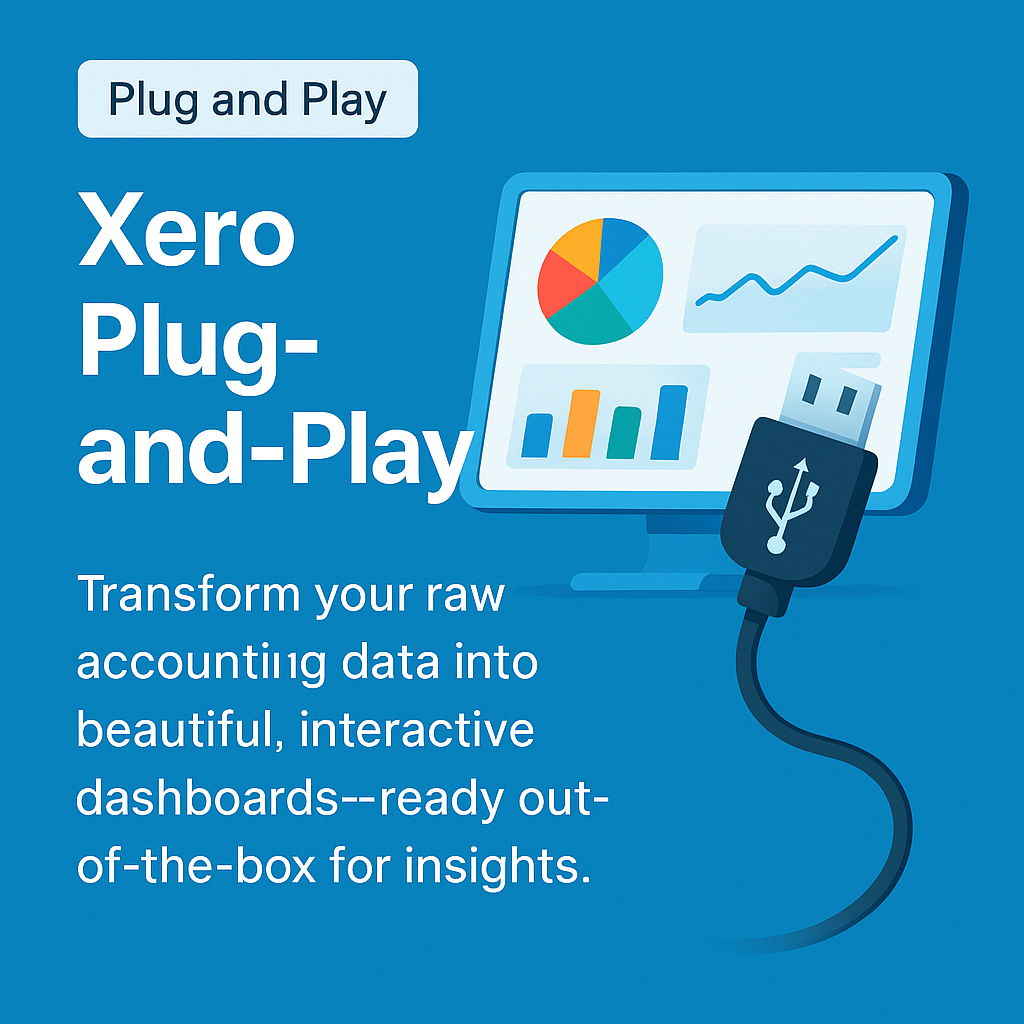
Seamlessly connect your Xero data to Tableau for instant insights. Our ready-to-use dashboards provide a comprehensive view of your financial health, enabling informed decision-making.

Seamlessly connect your Xero data to Tableau for instant insights. Our ready-to-use dashboards provide a comprehensive view of your financial health, enabling informed decision-making.


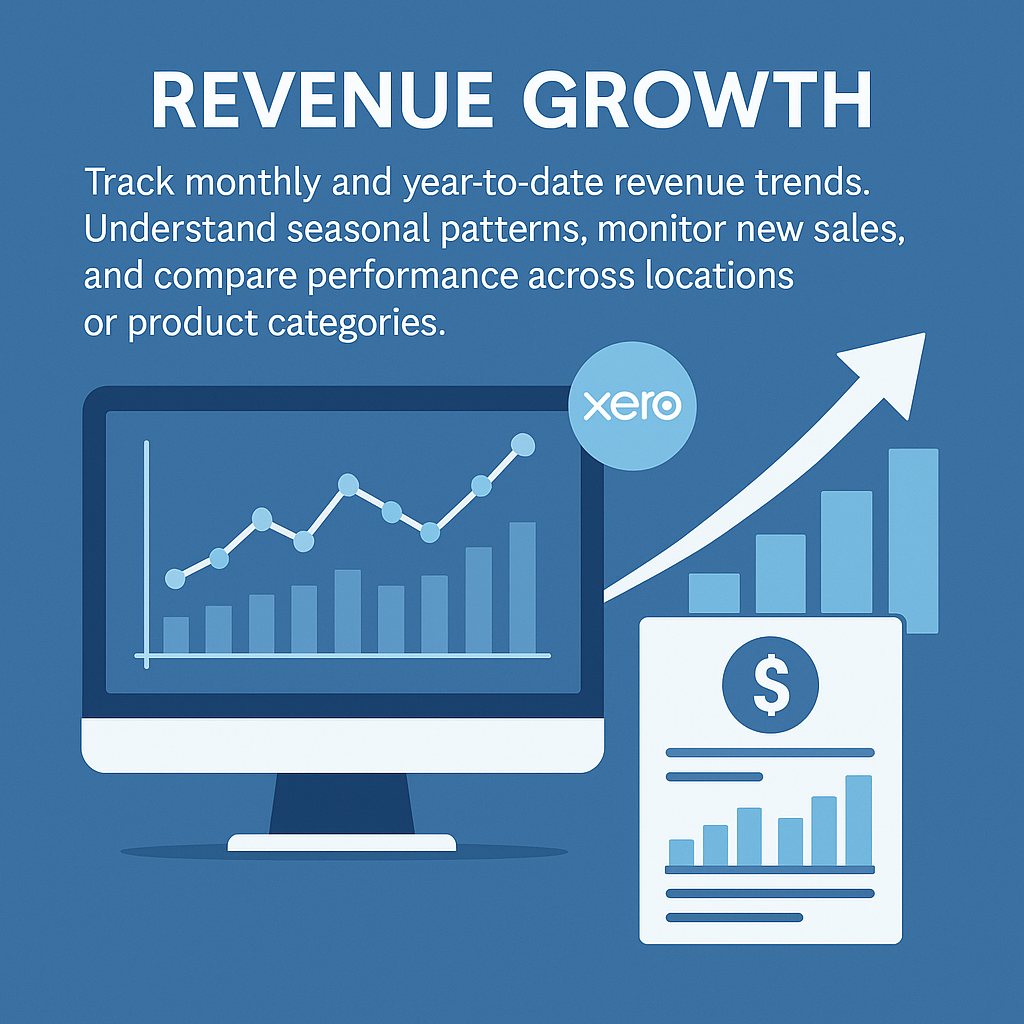
Track monthly and year-to-date revenue trends. Understand seasonal patterns, monitor new sales, and compare performance across locations or product categories.
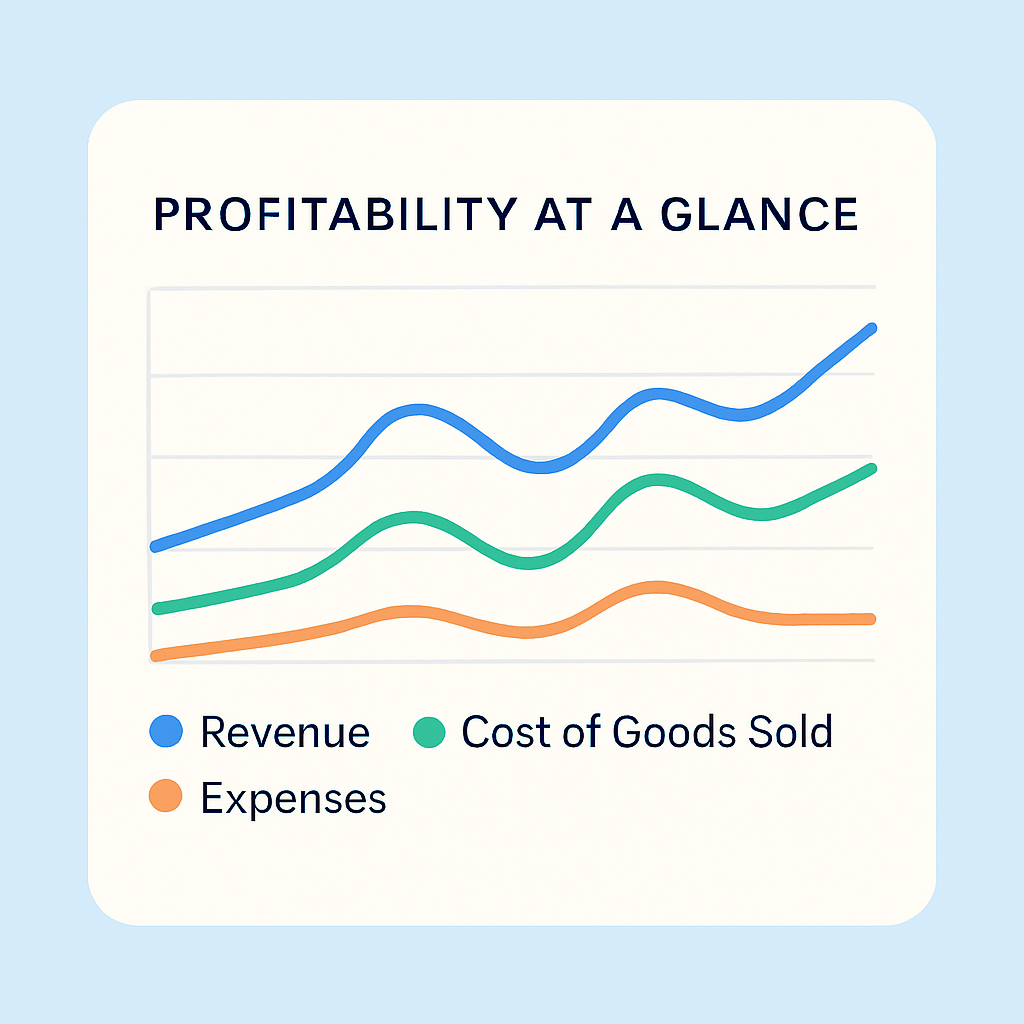
Visualize profitability at a glance. See how revenue, cost of goods sold, and expenses contribute to your bottom line across time periods.
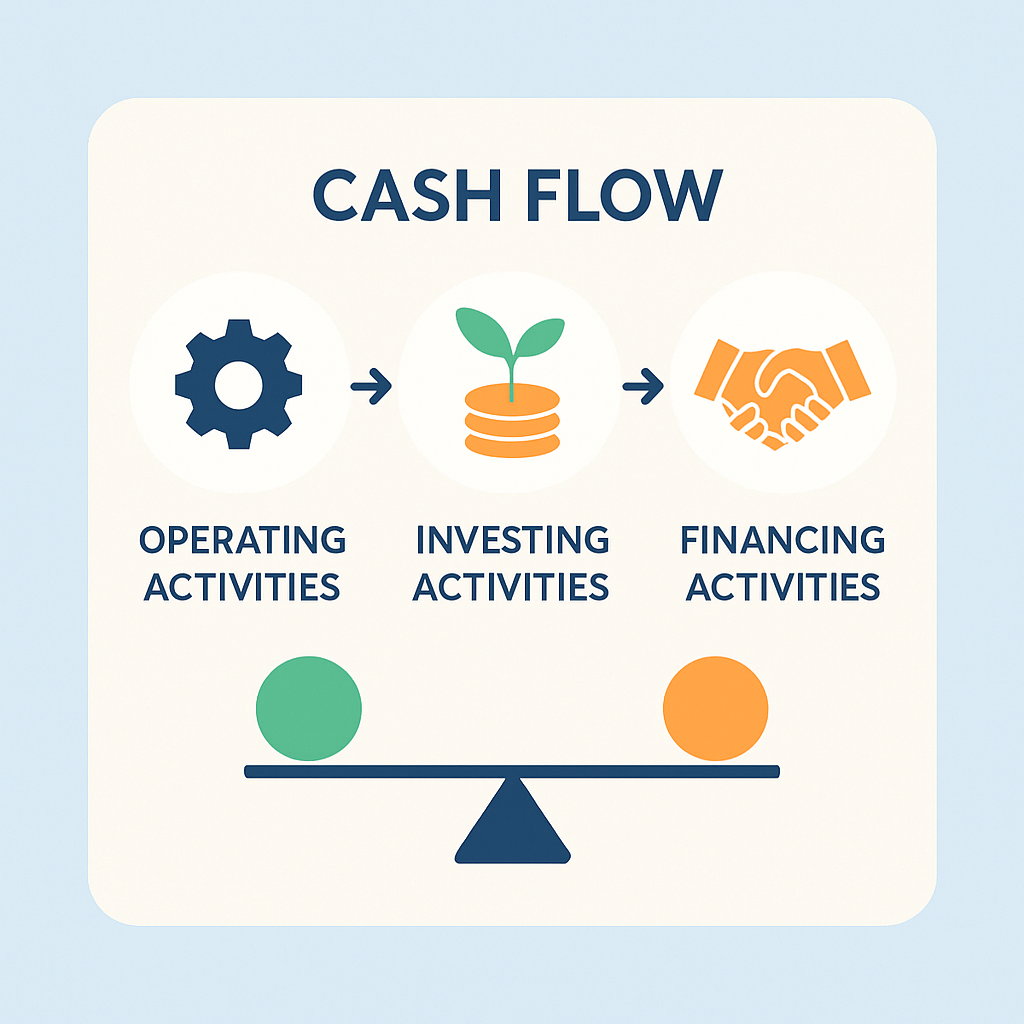
Understand how money moves in and out of your business. Monitor inflows and outflows across operating, investing, and financing activities with dynamic cash flow dashboards.
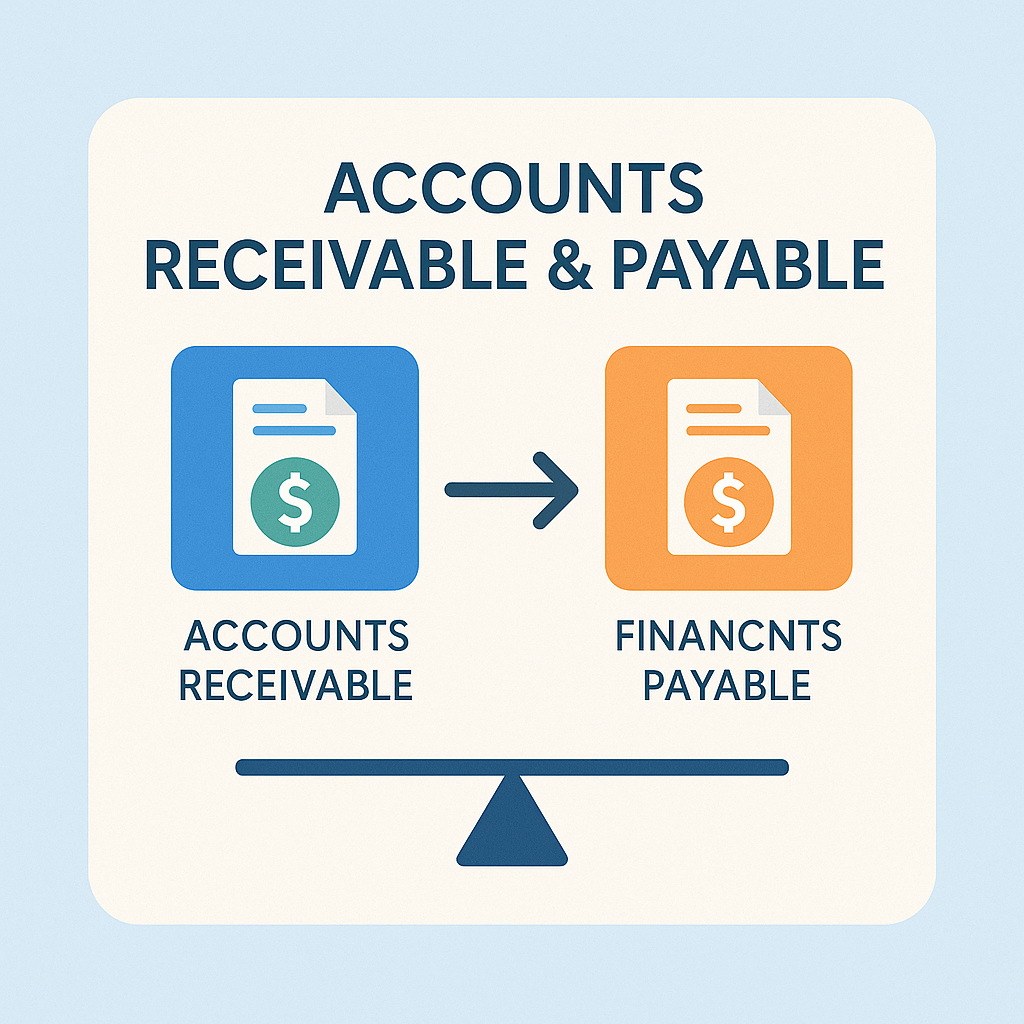
Track outstanding invoices and upcoming bills. Gain visibility into who owes you money and who you need to pay—sorted by aging, value, and due dates.
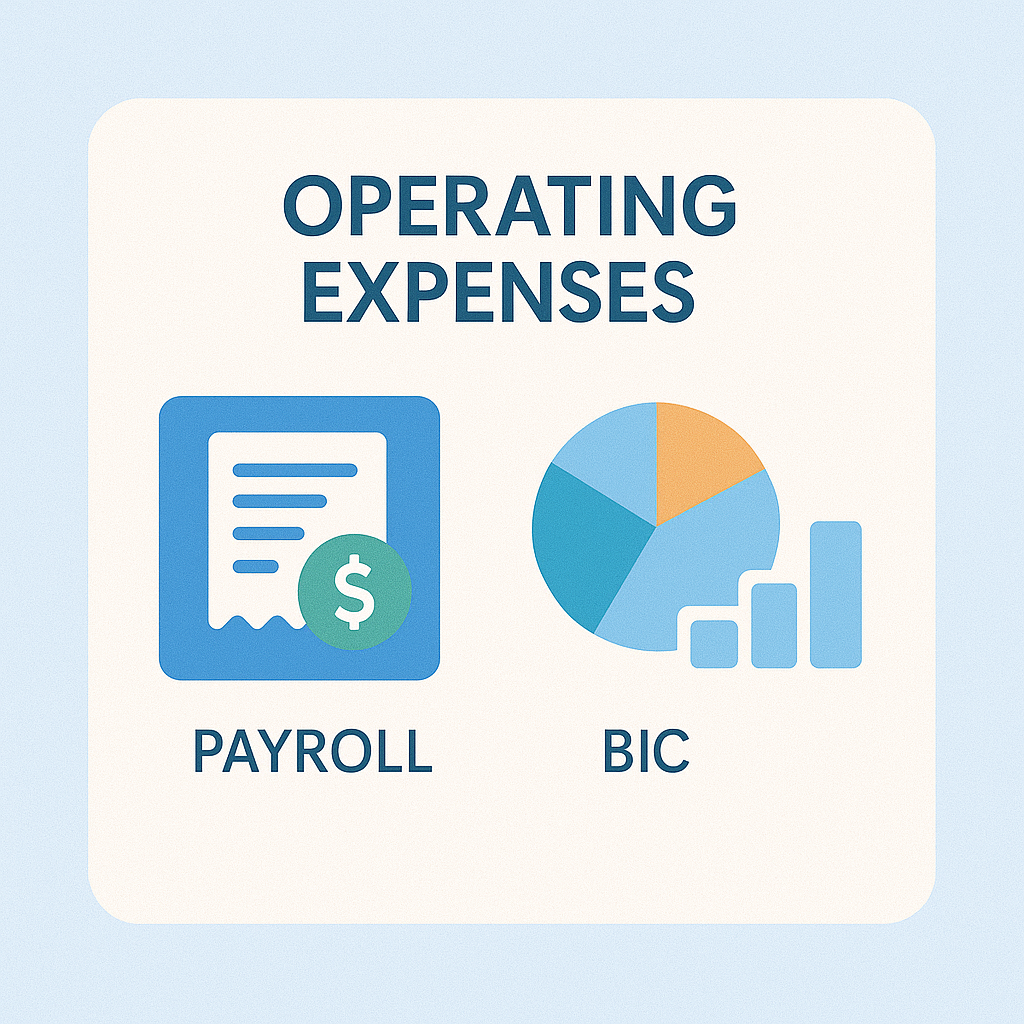
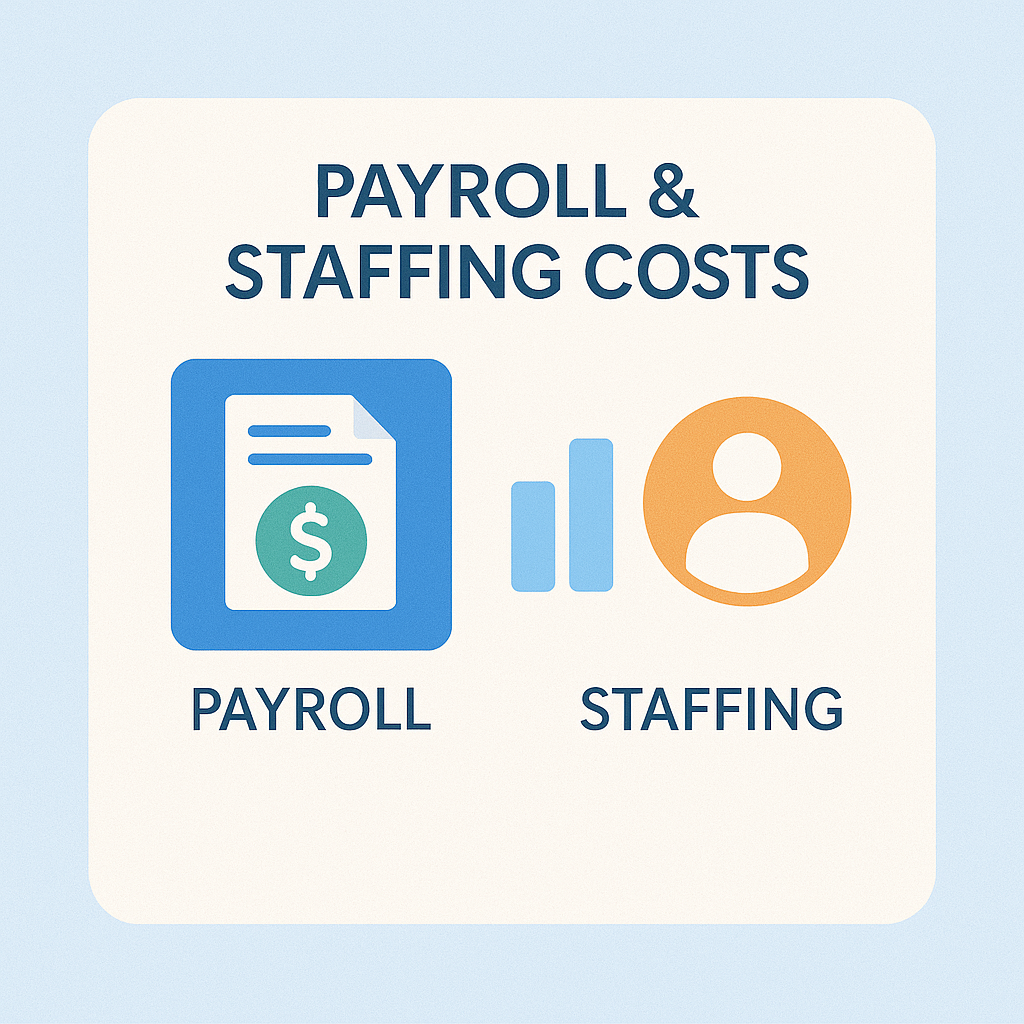
Analyze payroll costs by department or location. Monitor changes in headcount, salary trends, and their impact on profitability.
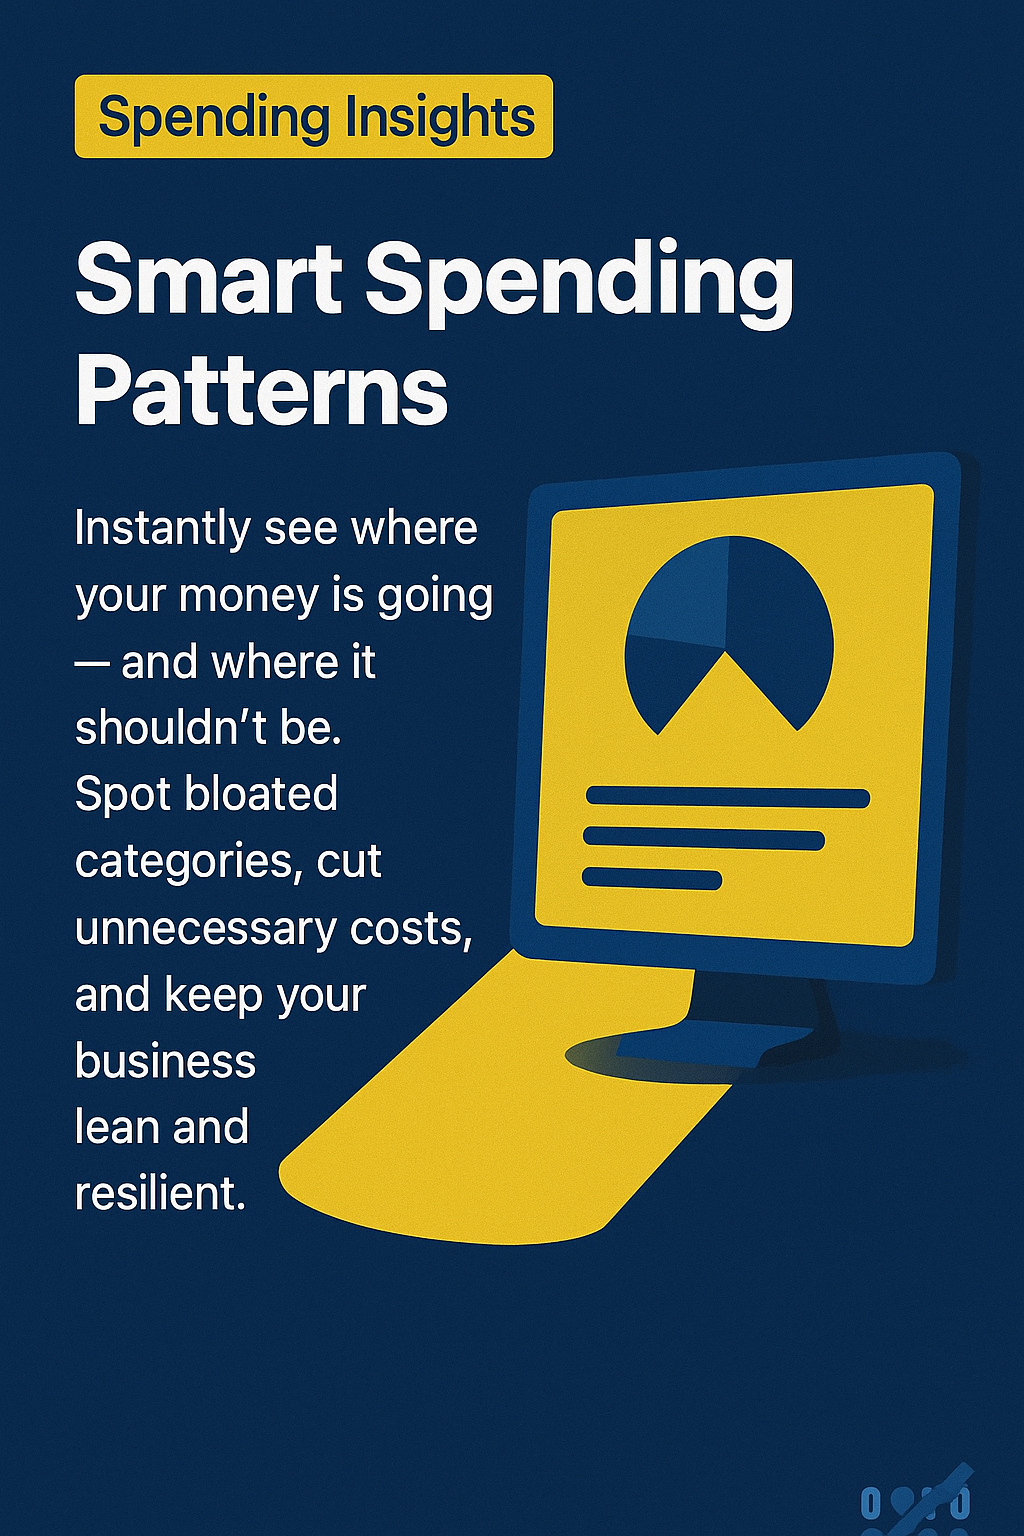
Drill down into operational spending. Categorize and visualize expenses to identify cost-saving opportunities and improve efficiency.