Retail & Consumer Analytics

Stop reconciling sales, stock and margin by hand. Start running retail on one trusted number.


DataDive builds the governed data model behind retail reporting — POS, ecommerce, inventory, supplier and finance data brought into one place, so store, merchandising and finance teams stop arguing about whose number is right and start working from the same one.

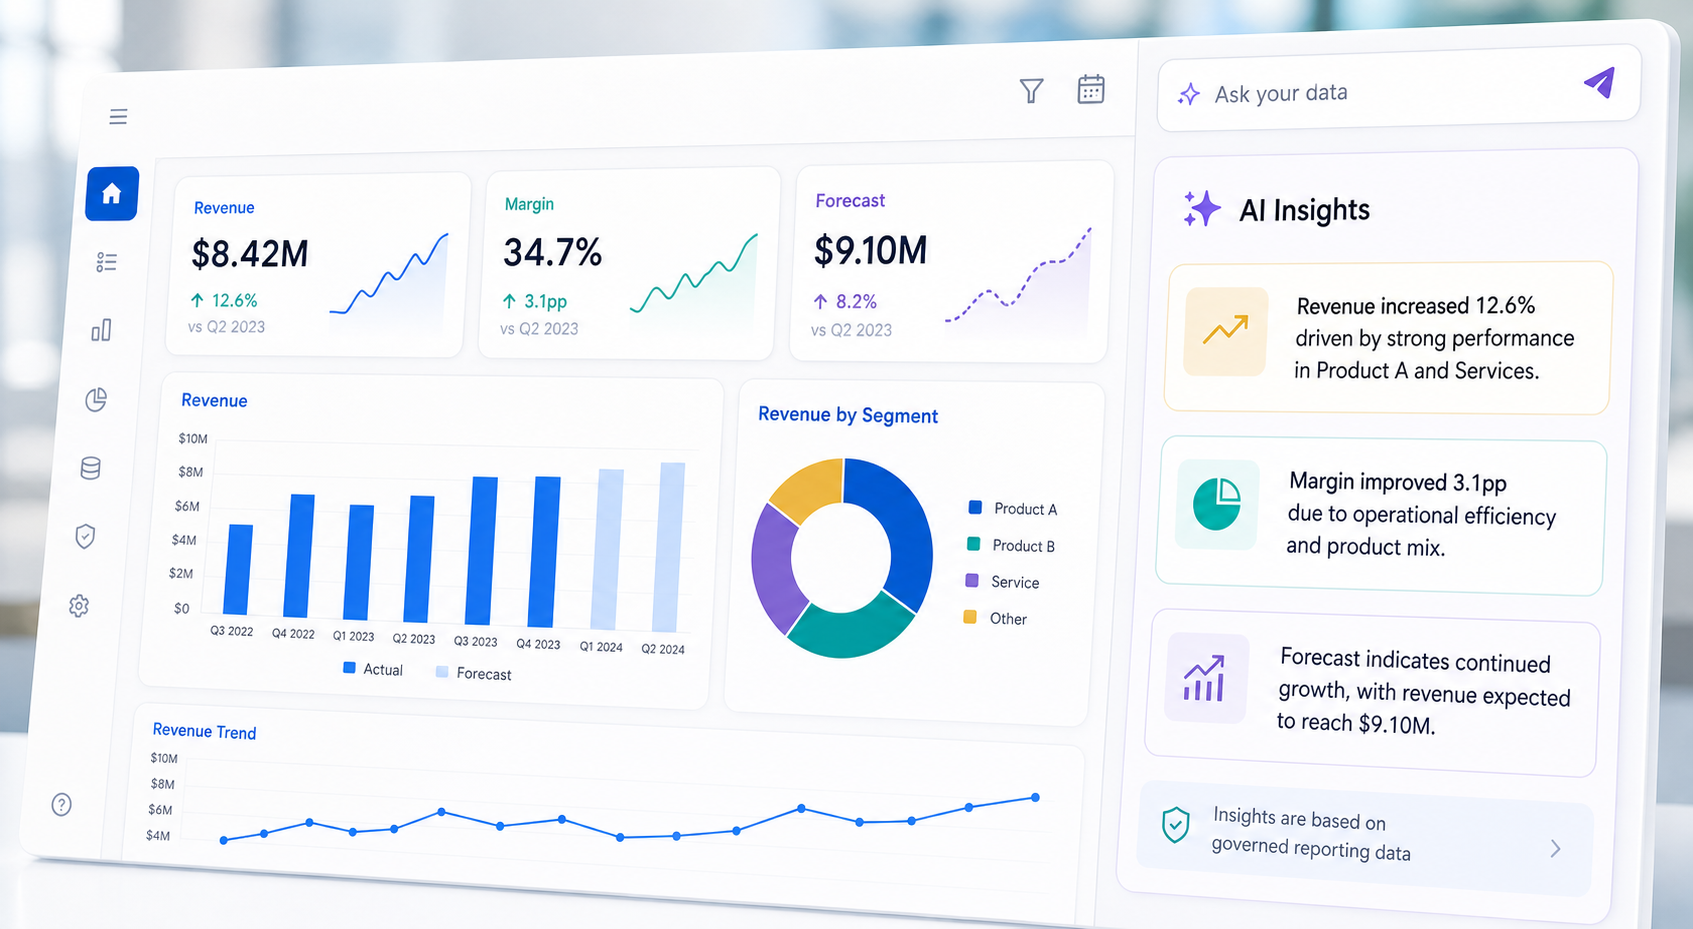
Example retail reporting dashboard with sales, margin and stock KPIs
Why retail teams call us

The reporting problems that actually cost retail businesses money

Without governed retail reporting

  • Sales, stock and margin numbers that don't match between POS, ERP and finance
  • A manual reconciliation exercise every week or every month-end
  • Inventory reporting that's days late, so stockouts and overstock get caught too late
  • Store and ecommerce data living in two disconnected reporting worlds
  • Every new question from leadership means another manual spreadsheet pull

With DataDive

  • One governed data model behind sales, stock and margin, that everyone works from
  • Reconciliation built into the pipeline, not a manual monthly task
  • Inventory reporting that reflects today, not three days ago
  • Store and ecommerce brought into one sales and customer view
  • Dashboards built to answer the next question, not just today's

Six ways we bring retail data under control

Each pillar can be built as its own phase — most retail engagements start with the first one and expand from there.

01

One Number for Sales, Stock and Margin

Retail performance reporting.

A single governed view of sales, stock and margin across stores, channels and SKUs — built once in the warehouse, not recalculated differently in every spreadsheet and system export.

02

Real-Time Stock Visibility

Inventory & stock analytics.

Stock-on-hand, stock-in-transit and reorder signals pulled from POS, ecommerce and warehouse systems into one current view, so stockouts and overstock get caught before they cost margin.

03

See What's Actually Selling

Merchandise & category analytics.

Category, range and SKU-level performance — sell-through, markdown impact, category margin — without a manual pull from the merchandising system every reporting cycle.

04

One View of the Customer, In Store and Online

Customer & ecommerce analytics.

Store and ecommerce transactions, loyalty data and marketing platforms brought into one customer view, instead of two teams reporting two different pictures of the same customer.

05

Close the Month Without the Reconciliation Marathon

Finance & operations reporting.

POS, ERP and accounting data reconciled in the pipeline before reporting, not by finance manually matching numbers across three systems every month-end.

06

Retail Data Ready for AI

AI-ready retail reporting.

Sales, stock and customer data modelled and governed cleanly enough that forecasting and AI tools can actually use it — the same foundation the dashboards run on, not a separate export.

Systems we typically connect

We work with what you already run — the usual retail data sources feeding one governed model.

POS systems Ecommerce platforms ERP Inventory & warehouse management Finance & accounting (Xero, QuickBooks, MYOB) CRM Loyalty platforms Marketing platforms Supplier & product data feeds

What you actually get

The delivery, not just the pitch.

Governed data model

BigQuery or Snowflake warehouse structured around your stores, channels and product hierarchy.

Reusable metrics layer

Sales, stock and margin definitions built once in dbt, tested, and reused everywhere instead of redefined per dashboard.

Tableau / Tableau Next dashboards

Executive, merchandising, inventory and finance views built on the same governed model.

Automated refreshes

Scheduled pipelines, not a manual export-and-upload process someone has to remember to run.

Data quality checks

Reconciliation and freshness tests built into the pipeline, so mismatches get caught before a dashboard ships, not after.

Documentation & handover

Clear documentation of the model and metrics, handed to your team — or supported by us on an ongoing basis if you'd rather not own it.

Example dashboard packs

Illustrative of how the six pillars typically get grouped into dashboards — the actual pack for your business is built around your data, not a fixed template.

Executive Trading Pack

Sales, margin and trend versus target, by store and channel, for leadership.

Inventory Health Pack

Stock cover, aged stock, and reorder signals across stores and warehouses.

Merchandise Performance Pack

Category and SKU-level sell-through, markdown impact, and category margin.

Customer & Ecommerce Pack

Customer acquisition, retention and channel mix across store and online.

Finance & Operations Pack

Reconciled sales-to-finance reporting and operational cost tracking.

Why retail teams trust DataDive with this

15+

Years in data & BI

Salesforce AppExchange
consulting partner

AWS partner,
Google Cloud experience

BigQuery, Snowflake,
dbt, Tableau capability

Recent retail engagement

[NK — replace with the real, anonymized detail: what retail business (size/type, no name), what was broken (e.g. sales/stock/margin mismatch, late inventory reporting), what we built, and what changed. Keep it specific and honest rather than a generic "leading retailer" claim — that's the whole point of this page.]

Every retail engagement starts with the same Data Health Check methodology used across DataDive's other work — a short, practical review before any build commitment.

Retail Analytics FAQ

We work with what you already run. The usual approach is to connect your existing POS, ecommerce platform, ERP, inventory system and accounting tool into one governed warehouse rather than replacing any of them — the goal is one trusted reporting layer on top, not new operational systems underneath.

Most retail systems report well on their own data and poorly across systems. The problem we're usually called in for is reconciling sales, stock and margin across POS, ecommerce, inventory and finance at once, with one set of business definitions everyone uses, rather than exporting from each system and reconciling by hand.

Yes — multi-store and multi-channel is the normal case, not an edge case. The data model is built to roll up store-, channel- and SKU-level detail into consistent executive, merchandising and finance views without duplicating logic per channel.

A short, practical review of your current sales, stock, margin and finance reporting: which systems hold the data, where numbers disagree today, how reporting currently gets built, and what a governed model and dashboard set would look like for your business. It's a diagnostic, not a sales pitch for a fixed scope of work.

It depends on how many systems are involved and how clean the source data already is, but the pattern is to get one solid pillar (usually sales, stock and margin) live first, then extend into merchandise, customer/ecommerce and finance reporting in following phases, rather than one long build before anything is usable.

Ready to see where your retail numbers disagree?

Start with a Retail Data Health Check — a short, practical review, not a sales pitch.

Book a Retail Data Health Check