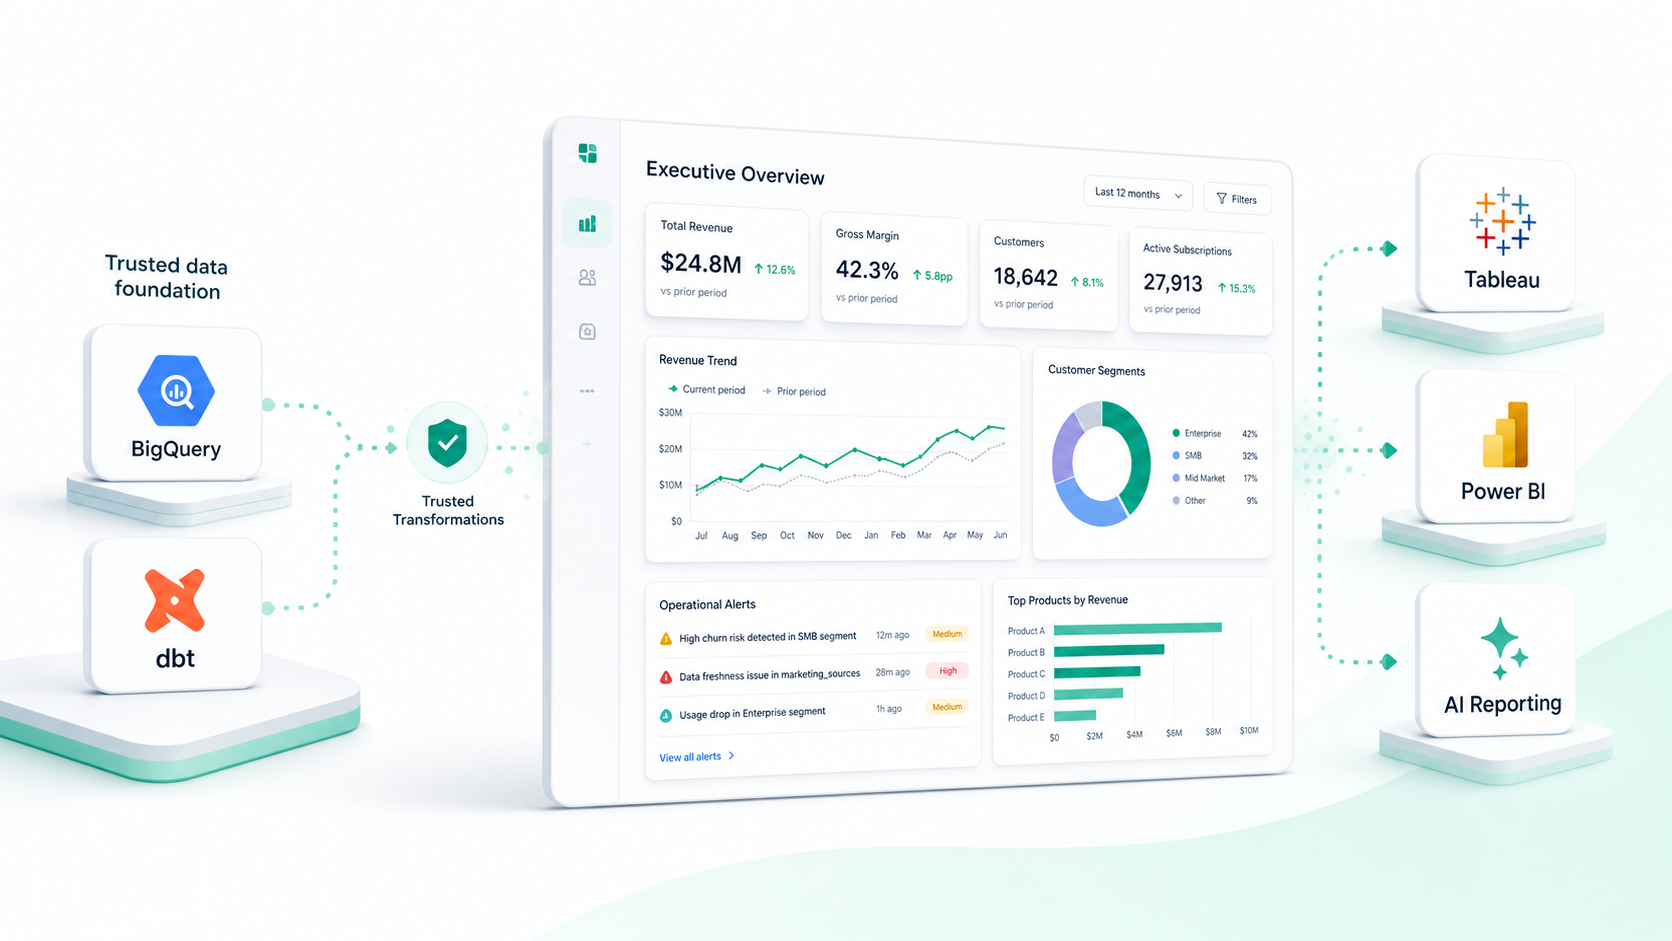
Dashboards shaped around user decisions
Lead with the question, not the chart type.
We translate executive, operational, and team-level reporting needs into dashboard flows that help users answer the next question quickly.
We design Tableau-first dashboards, executive reports, and operational reporting that connect cleanly to your BigQuery, dbt, and data engineering foundations. Where the business needs it, we also support Power BI and AI-based reporting.
DataDive builds Tableau-first reporting for Perth and Western Australia organisations that need executive dashboards, operational dashboards, workbook remediation, and reporting connected to trusted BigQuery and dbt data foundations.
Delivered by DataDive's remote-first Australian consulting team with clear communication, practical tool expertise, and support across Perth and Western Australia.
Fix slow dashboards, broken data, or reporting issues - without long consulting cycles.
Tableau workbooks and reporting experiences designed for adoption, trust, and decision speed.
Lead with the question, not the chart type.
We translate executive, operational, and team-level reporting needs into dashboard flows that help users answer the next question quickly.
Models, extracts, and permissions aligned to the platform.
We keep Tableau development tightly coupled to source quality, model design, and access control so report logic is not scattered across disconnected workbooks.
Clean visual hierarchy and fewer competing signals.
We structure layouts, colour, annotation, filters, and navigation so decision-makers can interpret the signal quickly instead of working through clutter.
Performance is part of development, not an afterthought.
We optimise workbook structure, calculations, filters, and extract strategies so dashboards remain responsive as data volume and user counts grow.
From first dashboards to full reporting estates, we deliver usable Tableau experiences with stronger governance.
Summaries for leadership, not just analysts.
We build concise scorecards and drill-through experiences that let executives move from KPI summary to root cause without losing context.
Design for daily use, not occasional review.
For sales, customer, finance, and operations teams, we shape dashboards around workflows, exceptions, and the actions users need to take next.
Keep logic out of one-off workbook hacks.
We help centralise business rules, calculations, labels, and dimensional logic so reporting remains consistent across multiple dashboards and teams.
Fix what is slow, confusing, or fragile.
We improve inherited dashboards by simplifying logic, reducing workbook bloat, clarifying navigation, and resolving the performance problems that block adoption.
We position Tableau around the operating questions each team needs to answer, with practical reporting structures tailored to function, finance stack, and industry context.
Questions about dashboard design, delivery process, and reporting quality.
Strong Tableau delivery depends on clean source models, the right cloud setup, and support after launch.
Related services: