Tableau consultant Brisbane, Sydney and Melbourne
Tableau consulting for dashboards connected to trusted data
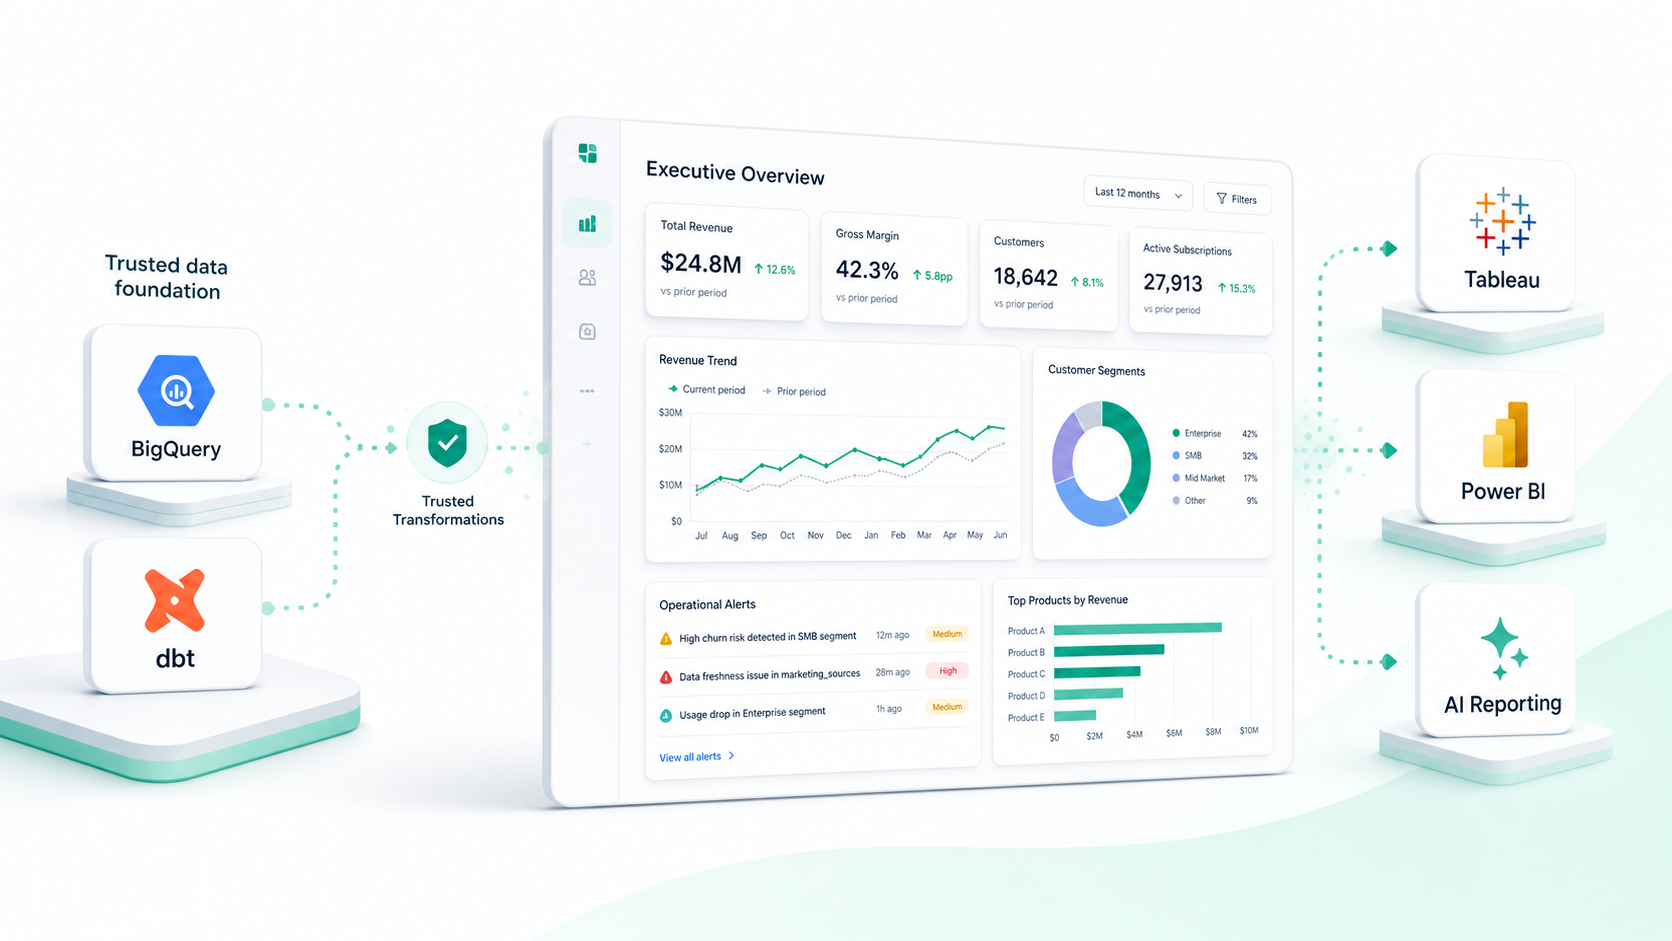
We design Tableau dashboards, executive reports, and operational reporting for Brisbane, Sydney and Melbourne teams that connect cleanly to BigQuery, dbt, and governed analytics warehouse models. Where the business needs it, we also support Power BI and AI-based reporting.
- Tableau consultant support for executive dashboards and operational reporting
- Workbook performance, UX, storytelling, and adoption
- Clean metric logic connected to BigQuery, dbt, governed datasets, Power BI, and AI reporting outputs
We keep a small Tableau Public page with basic chart and dashboard examples. Client work is usually private, so treat these as reference patterns rather than polished case studies.
Open Tableau Public examples
Planning Tableau Next, Tableau CRM or Salesforce CRM Analytics? DataDive also links to an official Salesforce AppExchange consulting partner profile for buyer verification.
Explore Tableau Next and CRM Analytics