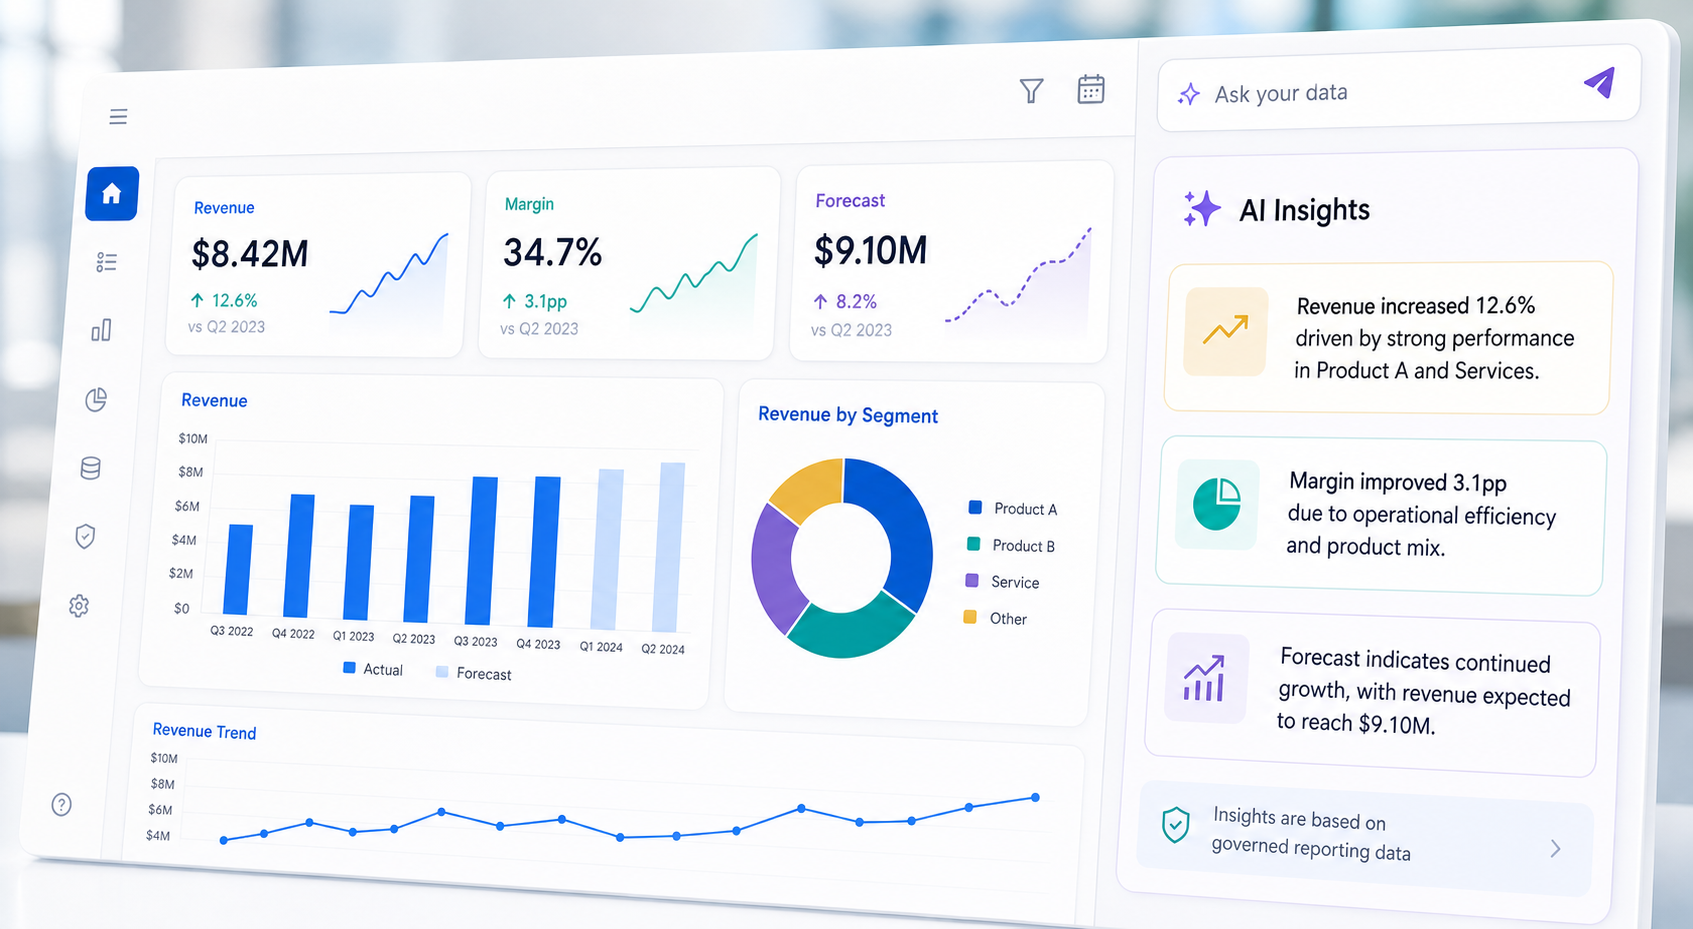














Data. Reporting. AI.
Built, governed and managed by our data experts.
From scattered data to decisions you trust.
We connect your systems, build a trusted data foundation, and create reporting your people use. Then we keep improving it together, turning feedback into new opportunities and better outcomes.
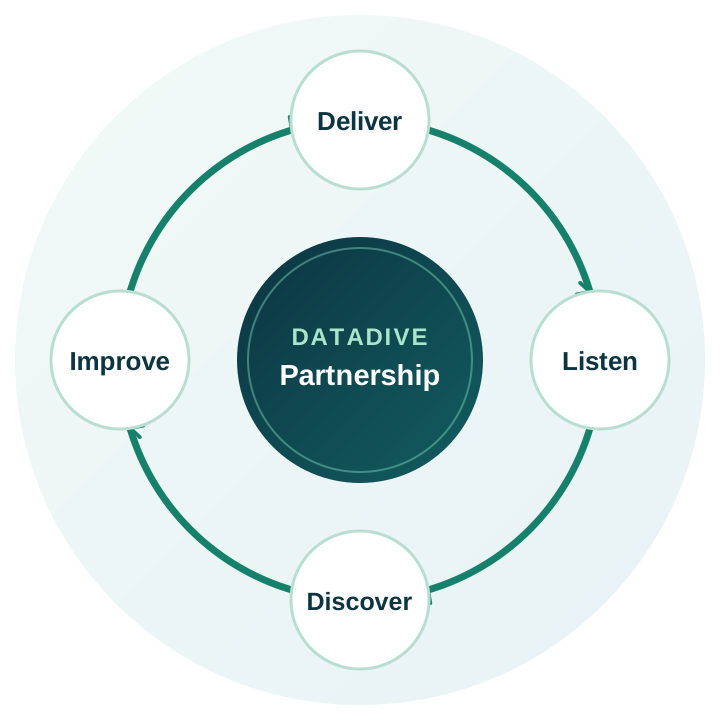
Every delivery starts the next improvement.
Our work continues after launch. Each cycle helps your data and reporting adapt to what your business needs next.
- 01
Deliver
Put trusted data, useful reporting and practical solutions in your team's hands.
- 02
Listen
Gather feedback from the people using the work and see what helps or gets in their way.
- 03
Discover
Spot new questions, changing needs and opportunities to create more value.
- 04
Improve
Refine the data, reporting and workflows, then deliver the next better version.
See what is happening. Know what to do next.
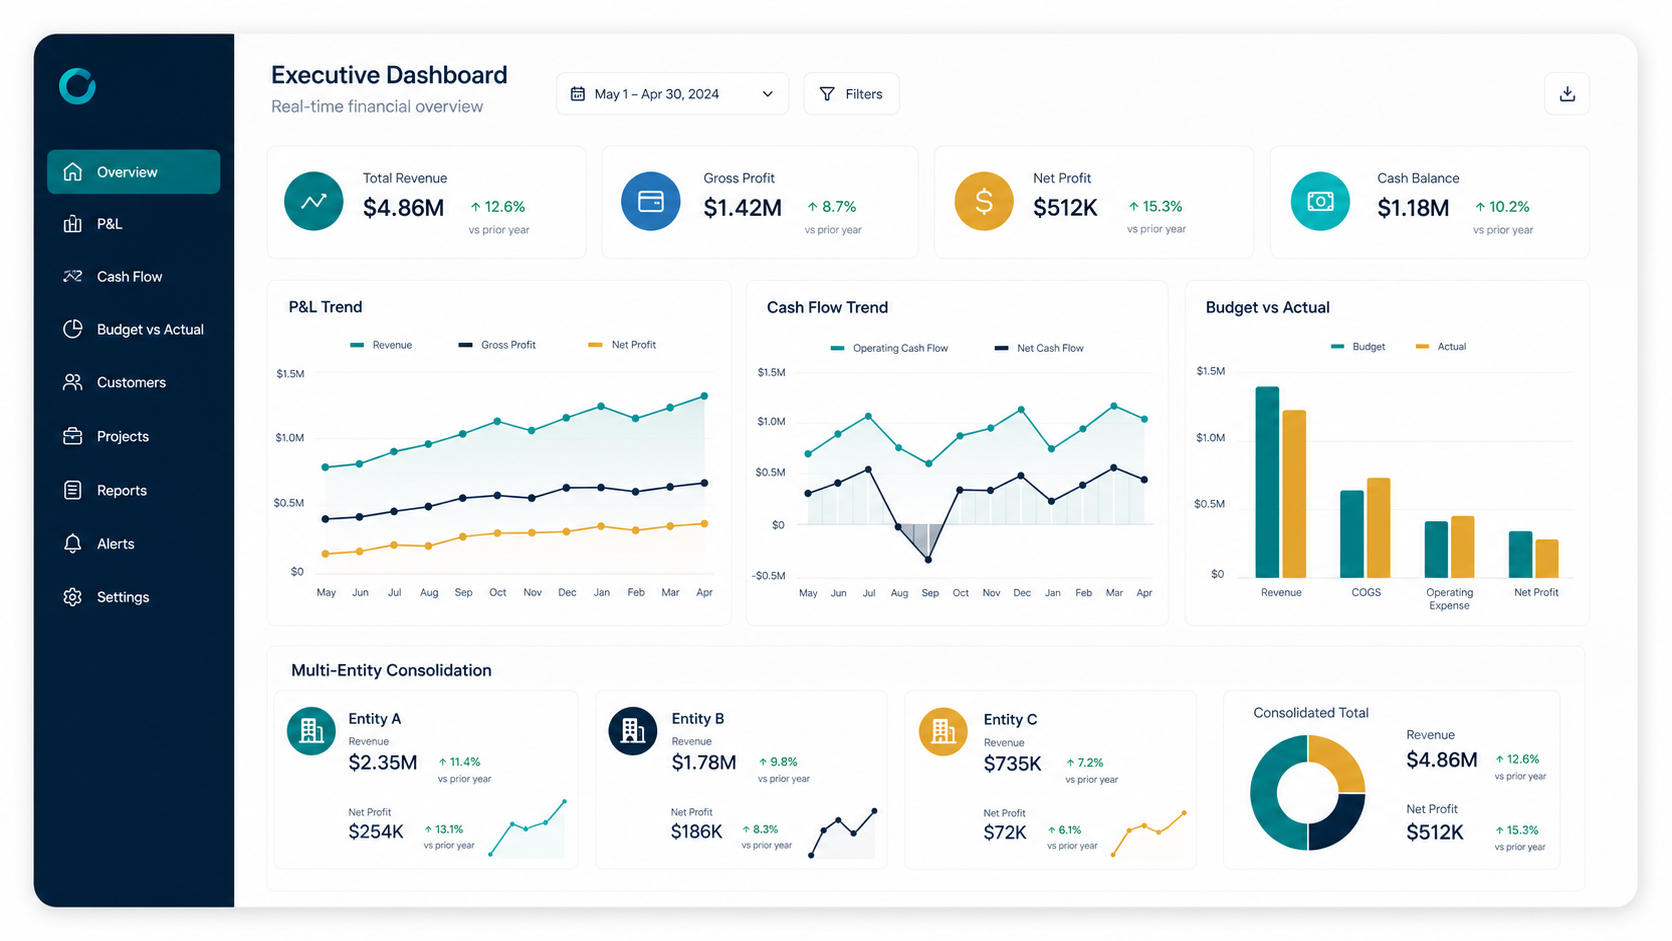
We turn trusted data into clear dashboards and shared measures, from executive reporting to the detail your teams need every day.
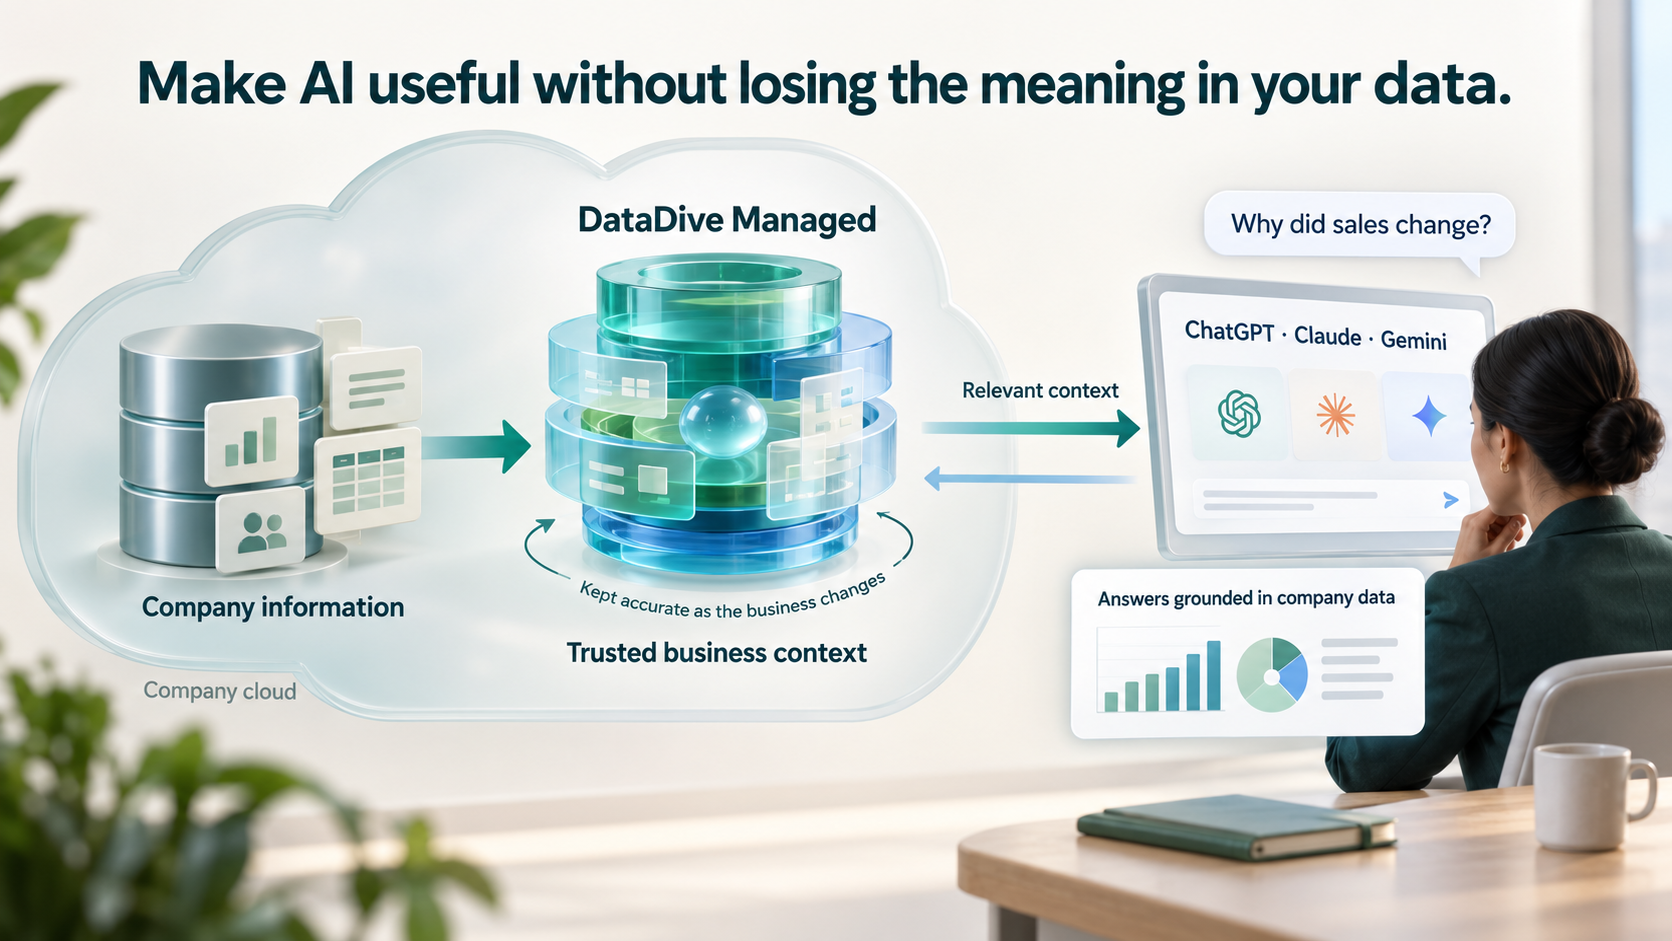
Answers grounded in your business.
Dashboards show what changed. DataDive Managed makes the meaning behind your measures available when someone asks why. We keep that context current, so your team can explore follow-up questions in the AI tool they choose.
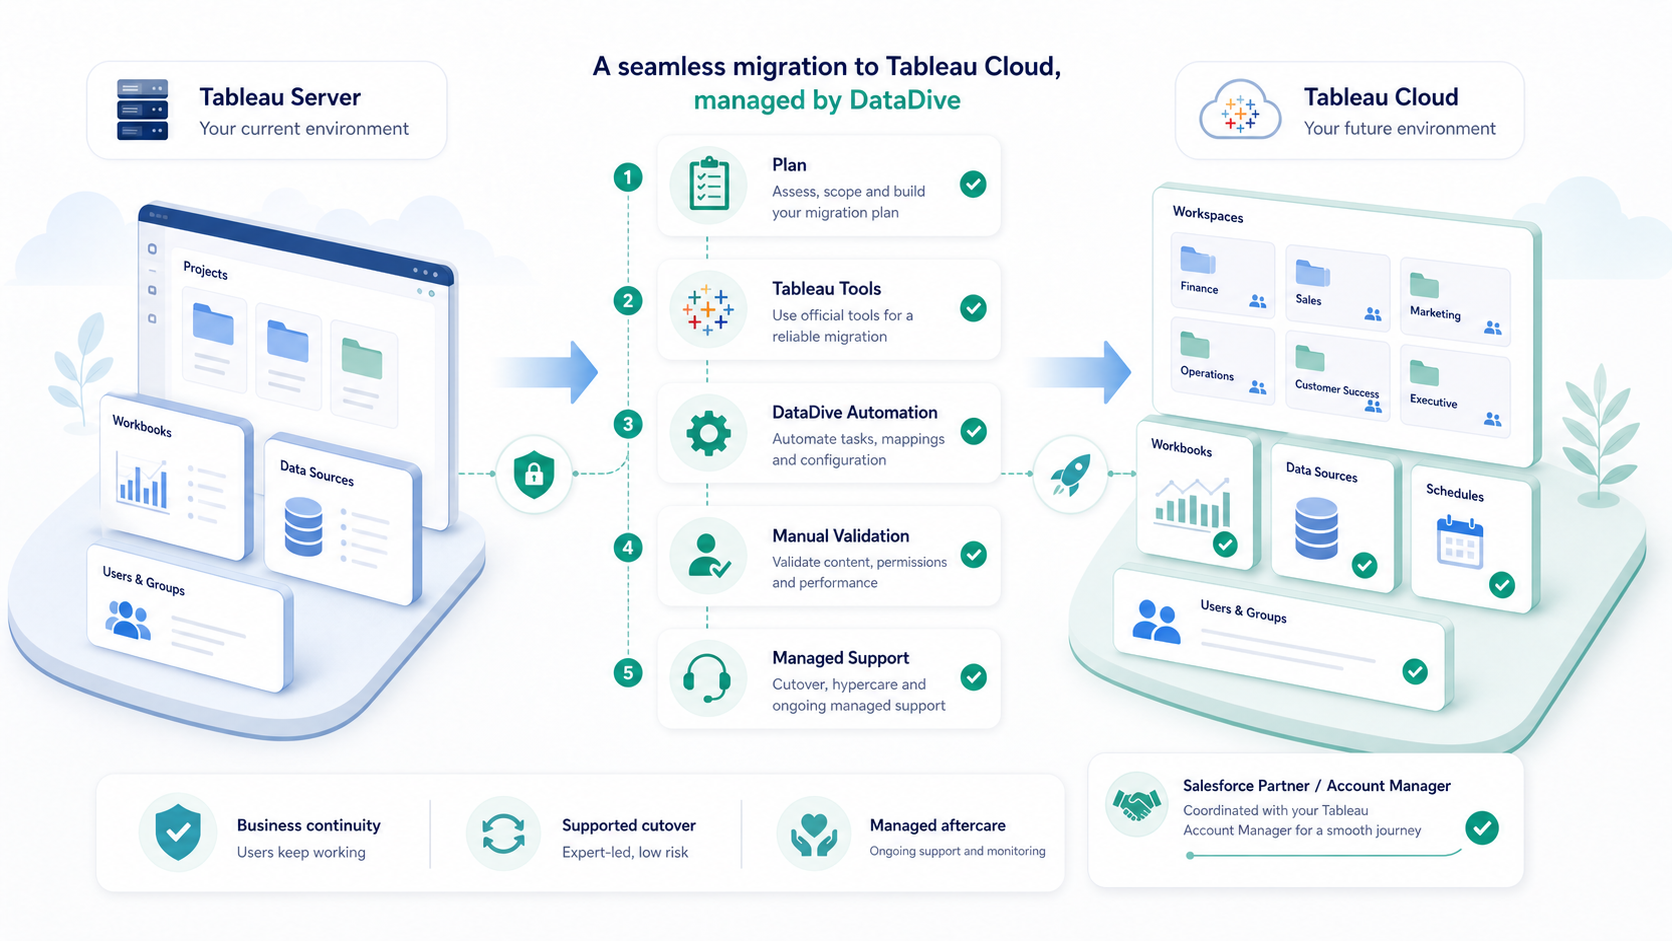
A fixed-price move to Tableau Cloud, managed end to end.
From Tableau Server to Tableau Cloud, our specialists handle the complex work: content, data connections, access and refreshes. We use proven tooling and automation where they help, verify your critical reporting, and stay with you through cutover and aftercare.
A dedicated team that stays with you.
Our customers call our care the gold standard. We are proud of the close, transparent way we work: your team can reach us in the chat tools you already use, while we keep an eye on your data and reporting. We shape ongoing support around your needs, and every DataDive development project includes 30 days of free bug fixes after delivery.
Across your whole data stack.
Reach us where your people already work.
Keep the work moving without adding permanent headcount.
When reporting backlogs grow or a project needs skills you do not have in-house, DataDive brings experienced Tableau developers, data analysts and data engineers to the work. Use the capacity you need for a project or ongoing delivery, with our wider team behind it.
Tell us what you need to make work better.
Whether it is scattered data, reporting, migration, AI or extra expertise, we will help you find a practical next step.
Start a conversation